PHP-level Performance Optimization with Blackfire
Throughout the past few months, we've introduced Blackfire and ways in which it can be used to detect application performance bottlenecks. In this post, we'll apply it to our freshly started project to try and find the low-points and low-hanging fruit which we can pick to improve our app's performance.
If you're using Homestead Improved (and you should be), Blackfire is already installed. Blackfire should only ever be installed in development, not in production, so it's fine to only have it there.
Note: Blackfire can be installed in production, as it doesn't really trigger for users unless they manually initiate it with the installed Blackfire extension. However, it's worth noting that defining profile triggers on certain actions or users that don't need the extension will incur a performance penalty for the end user. When Blackfire-testing live, make the test sessions short and effective, and avoid doing so under heavy load.
While it's useful to be introduced to Blackfire before diving into this, applying the steps in this post won't require any prior knowledge; we'll start from zero.
Setup
The following are useful terms when evaluating graphs produced by Blackfire.
-
Reference Profile: We usually need to run our first profile as a reference profile. This profile will be the performance baseline of our application. We can compare any profile with the reference, to measure the performance achievements.
-
Exclusive Time: The amount of time spent on a function/method to be executed, without considering the time spent for its external calls.
-
Inclusive Time: The total time spent to execute a function including all the external calls.
-
Hot Paths: Hot Paths are the parts of our application that were most active during the profile. These could be the parts that consumed more memory or took more CPU time.
The first step is registering for an account at Blackfire. The account page will have the tokens and IDs which need to be placed into Homestead.yaml after cloning the project. There's a placeholder for all those values at the bottom:
# blackfire:
#     - id: foo
#       token: bar
#       client-id: foo
#       client-token: bar
After uncommenting the rows and replacing the values, we need to install the Chrome companion.
The Chrome companion is useful only when needing to trigger profiling manually --- which will be the majority of your use cases. There are other integrations available as well, a full list of which can be found here.
Optimization with Blackfire
We'll test the home page: the landing page is arguably the most important part of any website, and if that takes too long to load, we're guaranteed to lose our visitors. They'll be gone before Google Analytics can kick in to register the bounce! We could test pages on which users add images, but read-only performance is far more important than write performance, so we'll focus on the former.
This version of the app loads all the galleries and sorts them by age.
Testing is simple. We open the page we want to benchmark, click the extension's button in the browser, and select "Profile!".
Here's the resulting graph:
In fact, we can see here that the execution time inclusive to exclusive is 100% on the PDO execution. Specifically, this means that the whole dark pink part is spent inside this function and that this function in particular is not waiting for any other function. This is the function being waited on. Other method calls might have light pink bars far bigger than PDO's, but those light pink parts are a sum of all the smaller light pink parts of depending functions, which means that looked at individually, those functions aren't the problem. The dark ones need to be handled first; they are the priority.
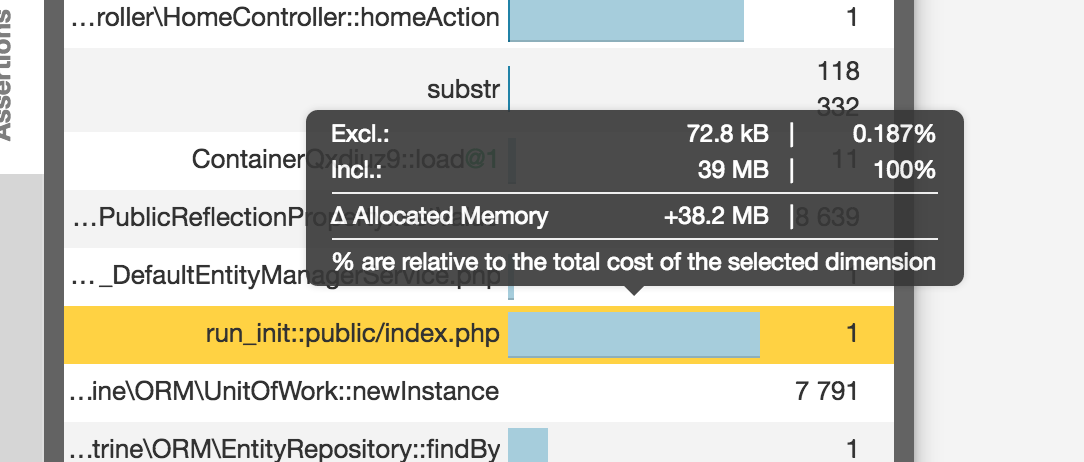
Also, switching to RAM mode reveals that while the whole call used almost a whopping 40MB of RAM, the vast majority is in the Twig rendering, which makes sense: it is showing a lot of data, after all.
In the diagram, hot paths have thick borders and generally indicate bottlenecks. Intensive nodes can be part of the hot path, but also be completely outside it. Intensive nodes are nodes a lot of time is spent in for some reason, and can be indicative of problems just as much.
By looking at the most problematic methods and clicking around on relevant nodes, we can identify that PDOExecute is the most problematic bottleneck, while unserialize uses the most RAM relative to other methods. If we apply some detective work and follow the flow of methods calling each other, we'll notice that both of these problems are caused by the fact that we're loading the whole set of galleries on the home page. PDOExecute takes forever in memory and wall time to find them and sort them, and Doctrine takes ages and endless CPU cycles to turn them into renderable entities with unserialize to loop through them in a twig template. The solution seems simple --- add pagination to the home page!
By adding a PER_PAGE constant into the HomeController and setting it to something like 12, and then using that pagination constant in the fetching procedure, we block the first call to the newest 12 galleries:
$galleries = $this->em->getRepository(Gallery::class)->findBy([], ['createdAt' => 'DESC'], self::PER_PAGE);
We'll trigger a lazy load when the user reaches the end of the page when scrolling, so we need to add some JS to the home view:
{% block javascripts %}
    {{ parent() }}

<script>
        $(function () {
            var nextPage = 2;
            var $galleriesContainer = $('.home__galleries-container');
            var $lazyLoadCta = $('.home__lazy-load-cta');

function onScroll() {
                var y = $(window).scrollTop() + $(window).outerHeight();
                if (y >= $('body').innerHeight() - 100) {
                    $(window).off('scroll.lazy-load');
                    $lazyLoadCta.click();
                }
            }

$lazyLoadCta.on('click', function () {
                var url = "{{ url('home.lazy-load') }}";
                $.ajax({
                    url: url,
                    data: {page: nextPage},
                    success: function (data) {
                        if (data.success === true) {
                            $galleriesContainer.append(data.data);
                            nextPage++;
                            $(window).on('scroll.lazy-load', onScroll);
                        }
                    }
                });
            });

$(window).on('scroll.lazy-load', onScroll);
        });
    </script>
{% endblock %}
Since annotations are being used for routes, it's easy to just add a new method into the HomeController to lazily load our galleries when triggered:
/**
 * @Route("/galleries-lazy-load", name="home.lazy-load")
 */
public function homeGalleriesLazyLoadAction(Request $request)
{
    $page = $request->get('page', null);
    if (empty($page)) {
        return new JsonResponse([
            'success' => false,
            'msg'     => 'Page param is required',
        ]);
    }

$offset = ($page - 1) * self::PER_PAGE;
    $galleries = $this->em->getRepository(Gallery::class)->findBy([], ['createdAt' => 'DESC'], 12, $offset);

$view = $this->twig->render('partials/home-galleries-lazy-load.html.twig', [
        'galleries' => $galleries,
    ]);

return new JsonResponse([
        'success' => true,
        'data'    => $view,
    ]);
}
The post PHP-level Performance Optimization with Blackfire appeared first on SitePoint.