Optimization Auditing: A Deep Dive into Chrome’s Dev Console
Chrome DevTools incorporates many sub-tools for debugging web applications on the client side --- like recording performance profiles and inspecting animations --- most of which you've likely been using since your early days of learning web development, mostly through the DevTools console.
Let's look at some of those tools, focusing particularly on the console and the performance metrics.
To access Chrome's DevTools:
- right click anywhere on a page, click Inspect from the context menu
- use the keyboard shortcuts
Ctrl + Shift + Ion Windows and Linux systems orAlt + Command + Ion macOS - use the keyboard shortcuts
Ctrl + Shift + Jon Windows and Linux systems orAlt + Command + Jon macOS.
The Snippets Tool
If you're frequently writing JavaScript code right in the console, make sure to use the Snippets feature of DevTools instead, which is similar to a code editor and provides mechanisms to write JavaScript code snippets, run them in the context of the current page and save them for later. It's better than writing multi-line JavaScript code directly in the console.
You can access the Snippets tool from the Sources panel. Once open, the console gets stacked below (if it doesn't, just press Escape) so you can write, run your code and see the console output at the same time.
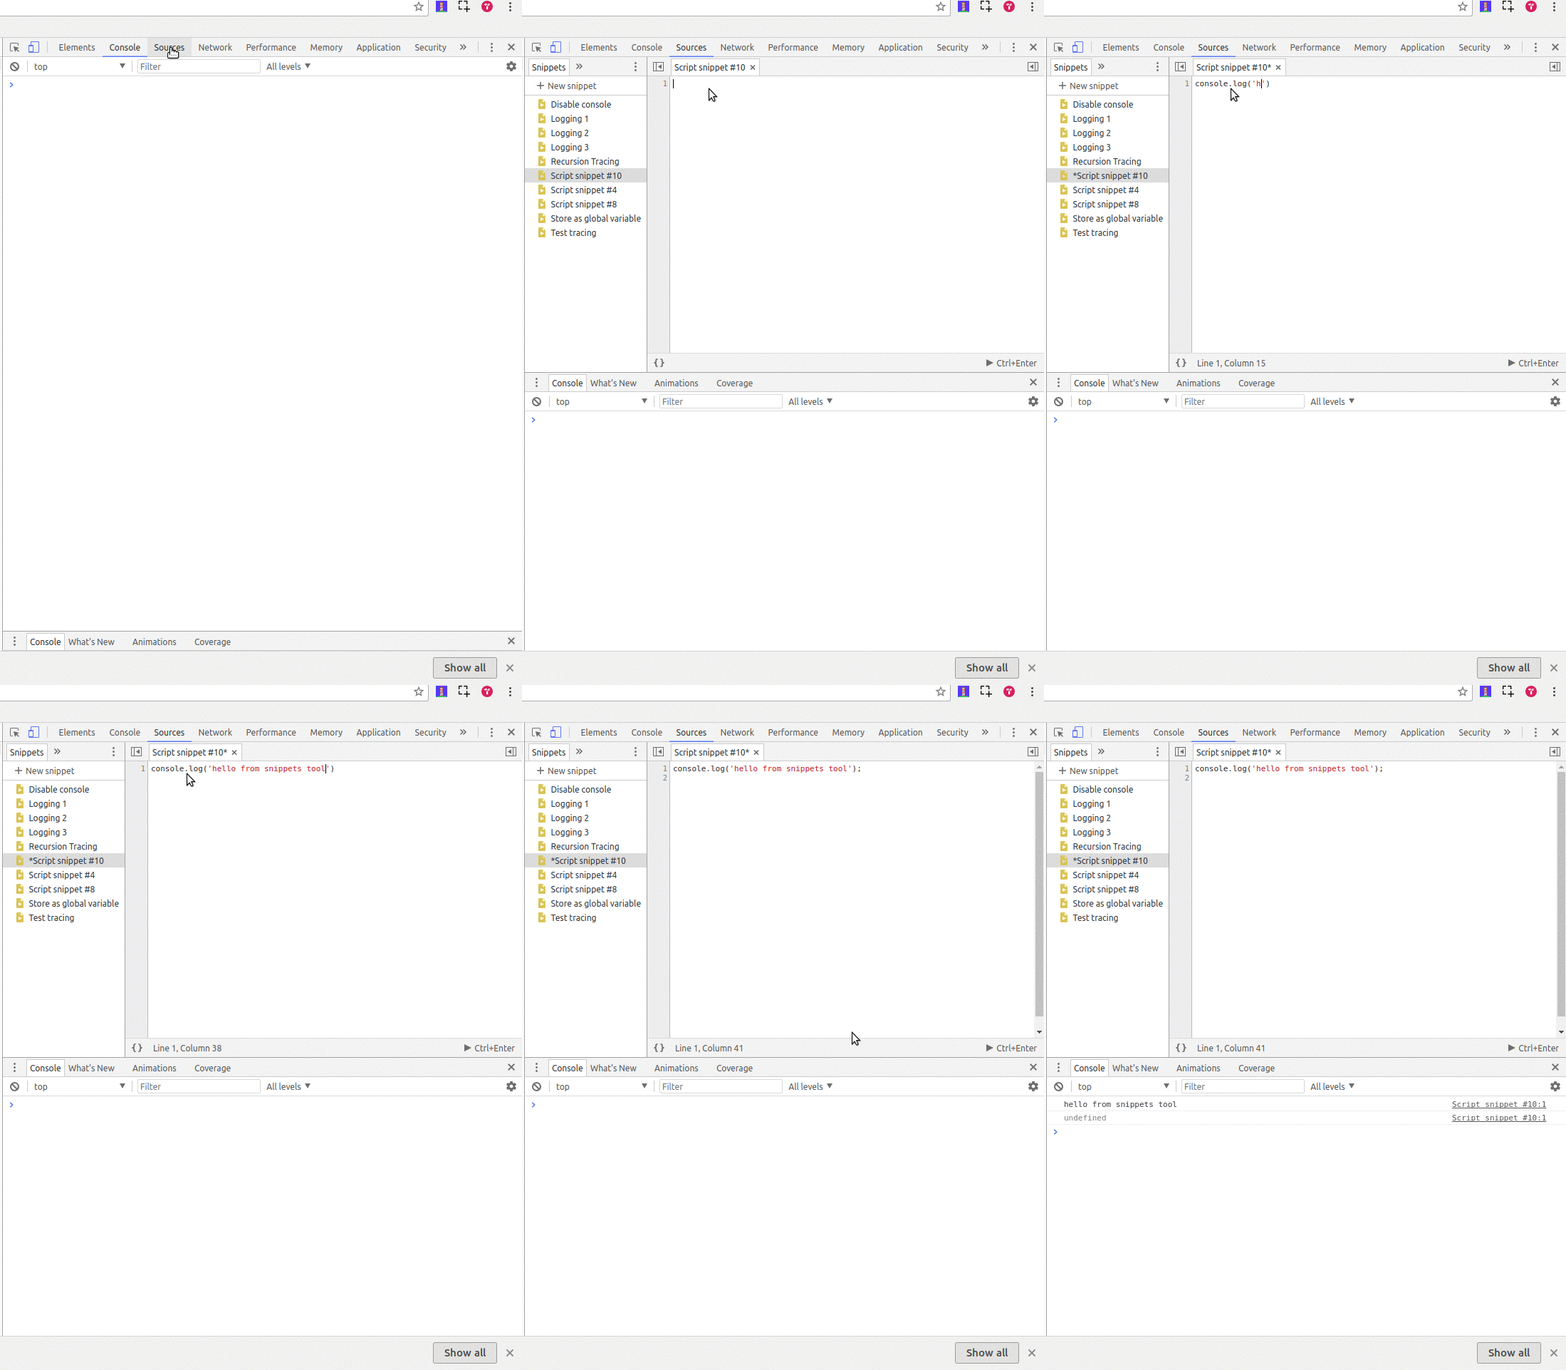
Using the Chrome DevTools Console
You can use the console to interact with any web page using JavaScript. You can query and change the DOM and query/output different types of performance information.
The console can be opened either as a full-screen dedicated panel or as a drawer next to any other DevTools panel by pressing Escape while DevTools is open and has focus.
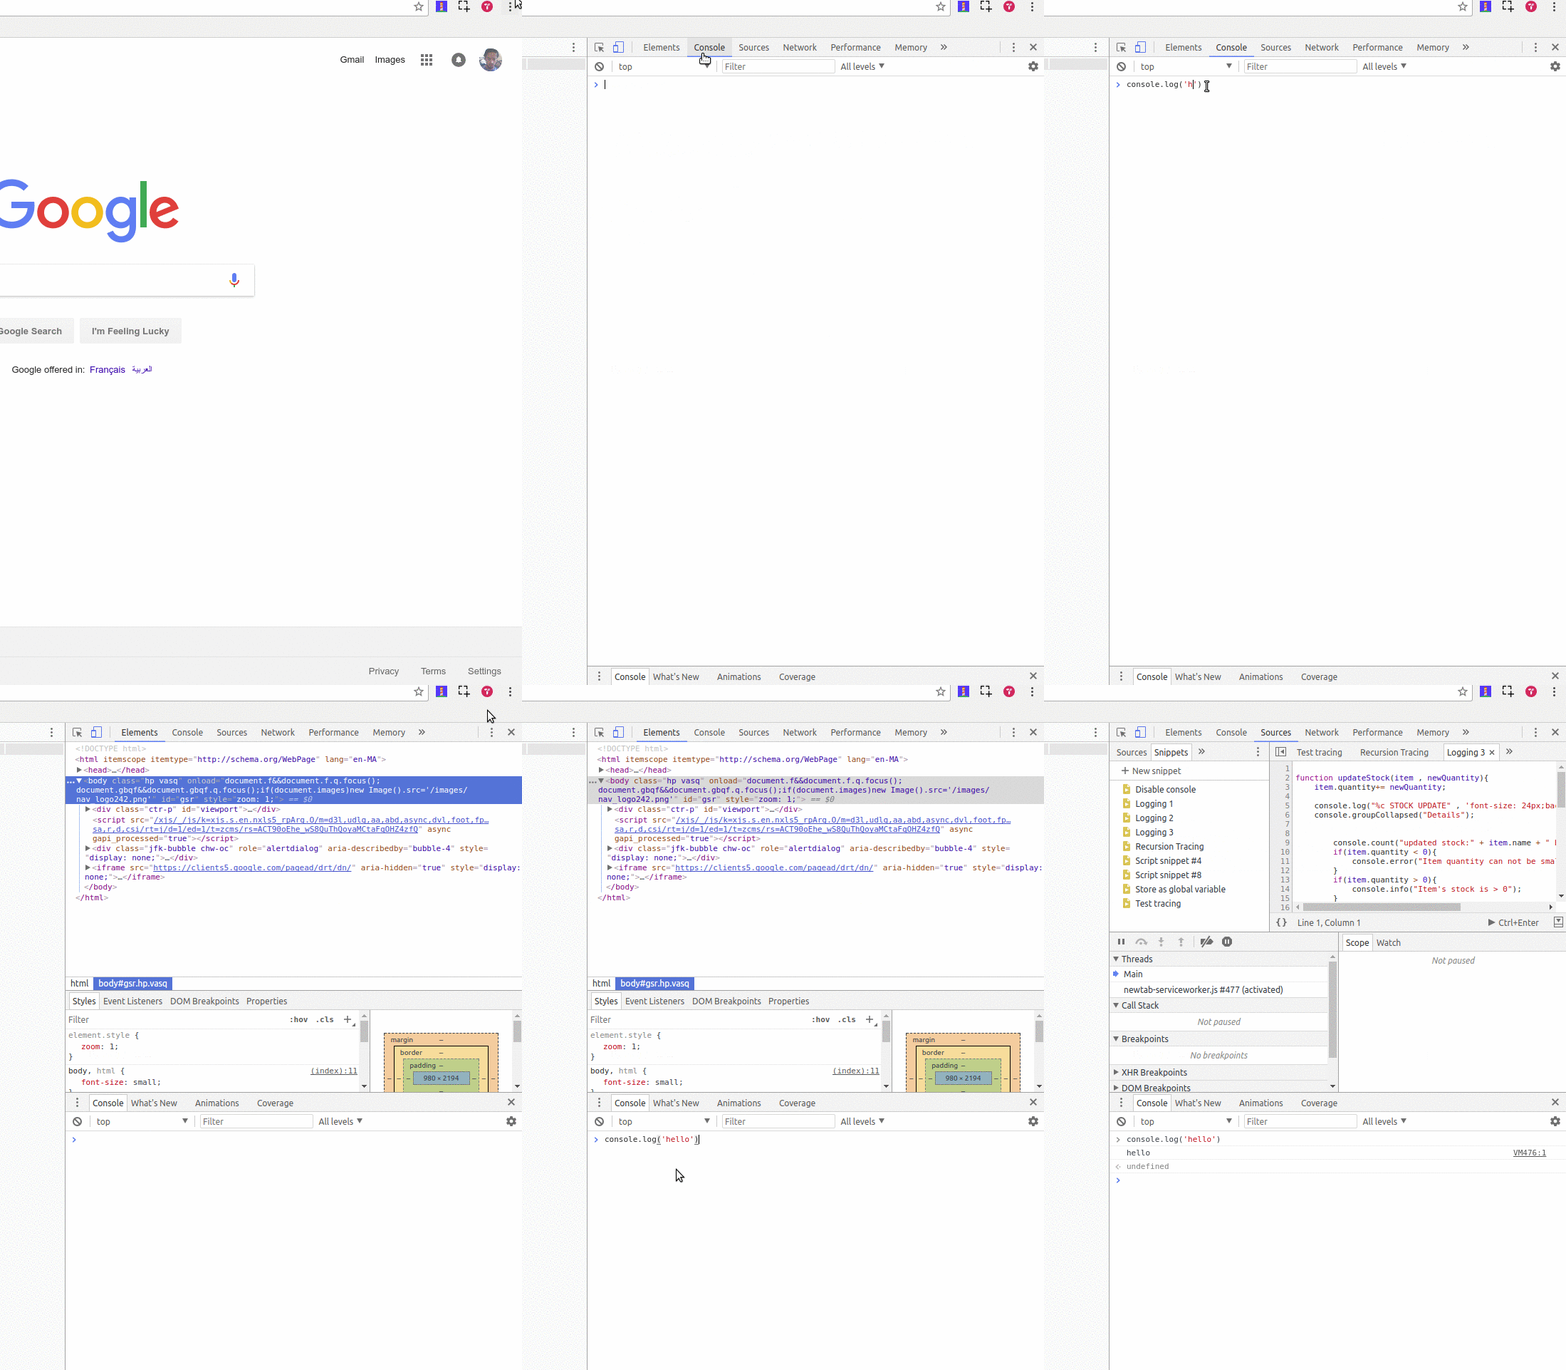
When working with the browser's console, if you want to enter multi-line expressions you need to use Shift + Enter, because just Enter will execute what's in the input line at that moment.
The console history
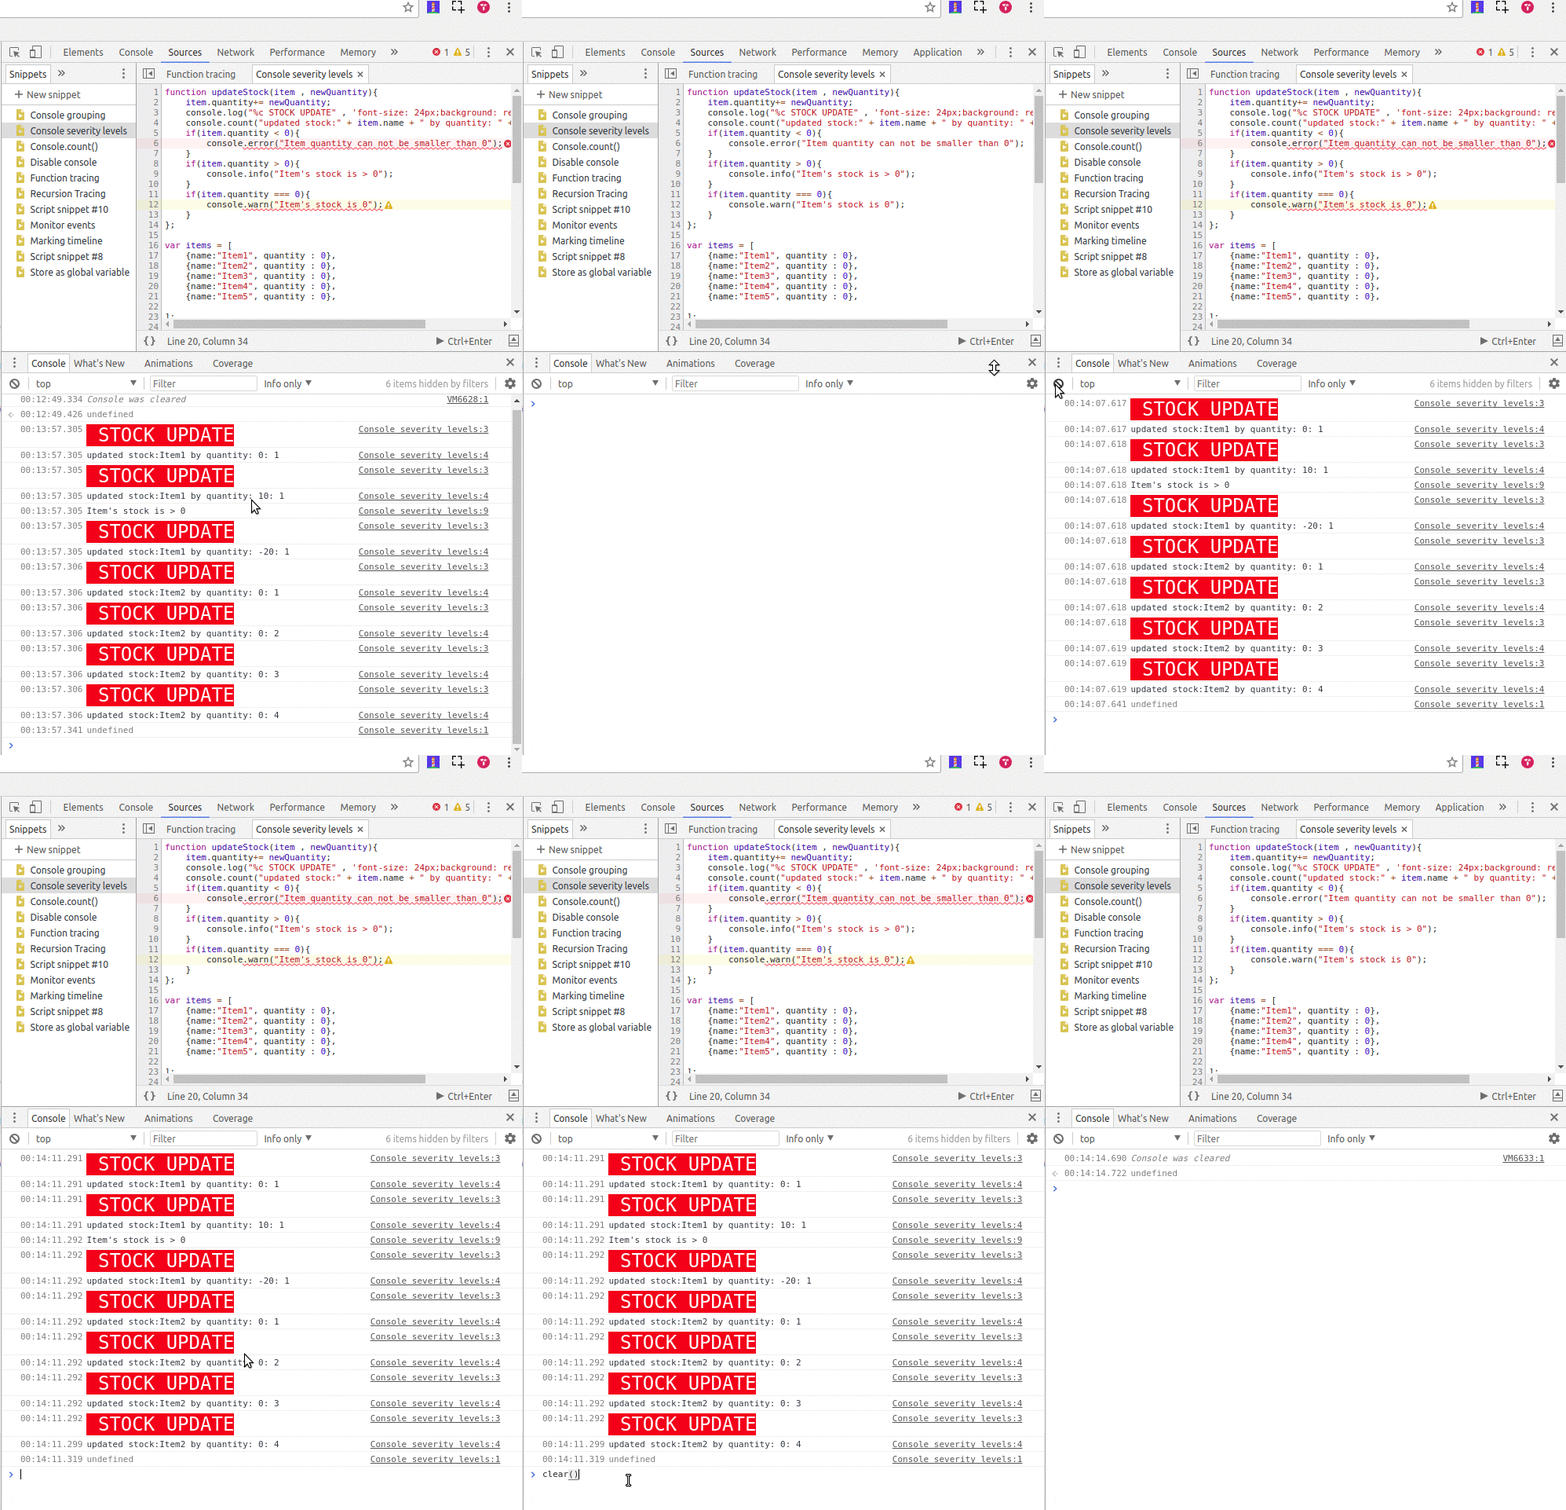
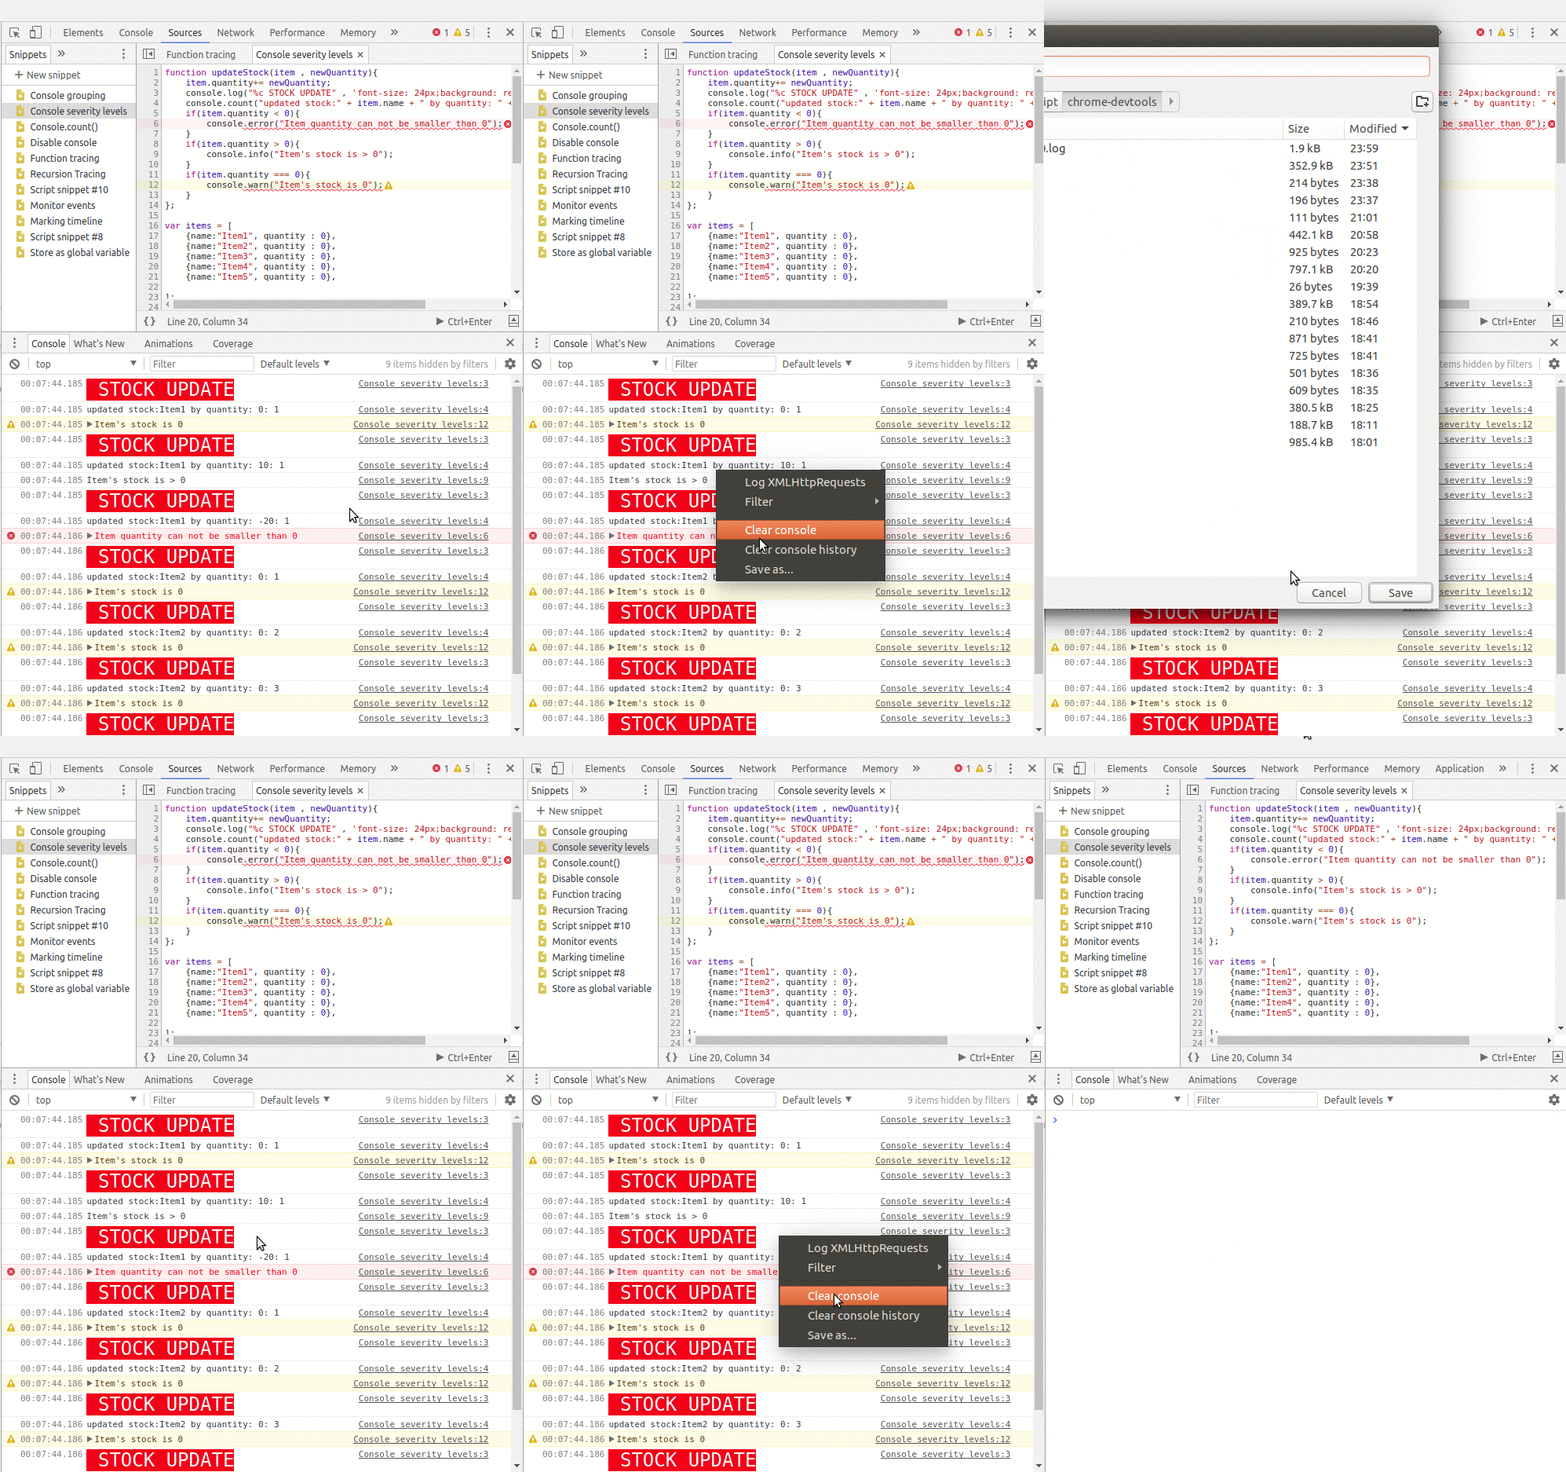
You can clear the console history in different ways:
- by typing
clear()in the console - by calling
console.clear()method in the console or JavaScript code - by clicking on the red circle in the top left corner of the console
- by pressing
CTRL+Lin macOS, Windows and Linux - by right-clicking in the Console and then pressing Clear console.
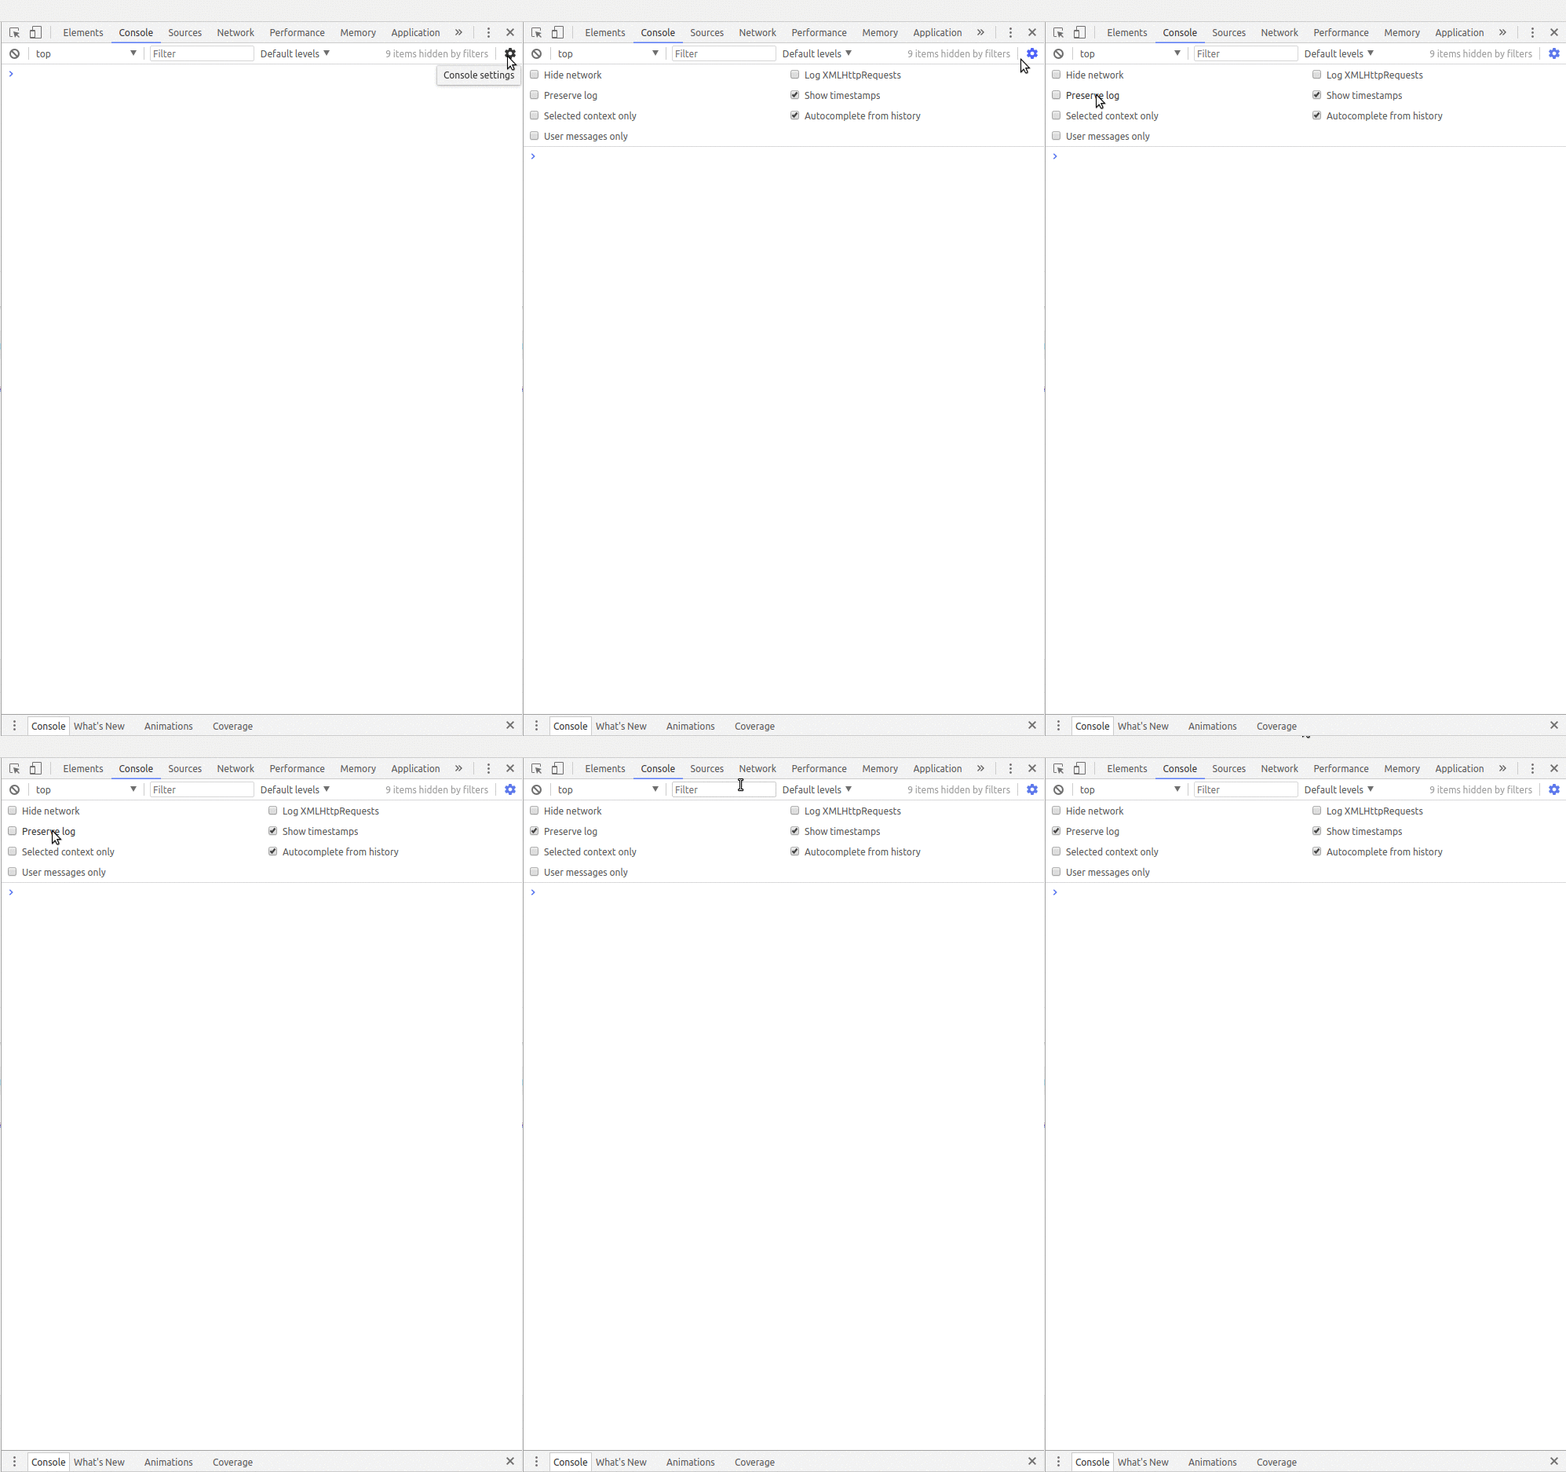
You can preserve the log (by enabling the Preserve log checkbox) between page refreshes or changes until you clear the console or close the tab.
You can save the history in the Console as a text file by right-clicking in the console and selecting Save as…, then choosing the location of a log file.
Console variables
The variables you create in the Console are persisted until you do a page refresh, so pay attention to when you're using keywords such as let or const when declaring variables. Running the same code or function for the second time will throw an Uncaught SyntaxError, saying that the identifier has already been declared. You can either use the OR (||) operator to check if the variable is already defined or you can use var to declare variables, since it doesn't complain for previously declared variables.
The post Optimization Auditing: A Deep Dive into Chrome’s Dev Console appeared first on SitePoint.